At the completion of the semester, you will write a reflective essay that summarizes your learning and growth during the class. These essays should be no more than 2,000 words. This is a chance for you to process your work and to consider the ways that it will contribute to your future ventures.
This is my last assignment of 2016. We finally made it.
Part of our assignment for this week–in addition to continuing to be the diligent and thoughtful students that we’re definitely, totally being on our projects–was to review another student’s website. Without posting the full review here, I was assigned Natalie Russell and Nick Ostermann’s site on the Gens de Couleur. They’re making an intriguing argument about the role free people of color (FPC) played in antebellum New Orleans and in turn demonstrating how they “whitened” themselves in official portraits and correspondence.
My greatest takeaway was the need for identifying and gearing presentation and media used to the audience you are trying to reach. Natalie and Nick had originally identified that they wanted to reach middle- and high-school students, and I think their biography style is a great way to give students something quick but still historically “deep” to read. I’d love to see them play up their primary sources, though, and play down their narrative. Maybe a catalog of the primary sources related to Julien Hudson at the top of the page, before the narrative, would help them do what I struggle with as an instructor–getting my students to actually engage with a primary document. A letter, rather than a portrait, would be even more ideal. While I love playing the “let’s analyze the coloration of American Progress” game as much as the next instructor, there’s something to be said for reading the handwriting and actual words of a wealthy New Orleans FPC.
She’s going from the light in the east to the darkness in the west! WHAT COULD IT MEAN?! Special shoutout to the one student of mine who complained about the two children riding in the covered wagon.
What this process has challenged me to do is better identify at whom I am targeting my map and the curated newspaper articles in my Omeka. The short answer I had at first was “I don’t know…grad students, probably.” On the whole I think that’s about where my thought process is at, because I don’t think historical electoral politics are getting a ton of people out of bed in the morning. I can better define that, though, and I will have to try and find a way to demonstrate that in my “About” section or my overall argument.
In “Cory doesn’t understand the Internet” news, I figured out Carto yesterday. Seriously, go look at my map. The findings could be wrong, insignificant, or just not that interesting, but I finally was able to make tidy data, upload shape files and datasets, merge them into a map, construct different layers, and display them in a manner approaching efficiency. It was the product of about two weeks of work and about 40 deleted maps and datasets (Carto kept uploading percentages as “strings,” not “numbers,” then deleting them when I’d try to convert them in the dataset), but it felt good to finally have that “Eureka!” moment yesterday.
But this is about what I don’t get about the Internet.
One thing I really enjoyed, going back to the review of Natalie and Nick’s project, was how Natalie embedded her Apple Music in her “About” page. That seems like a fun way to put yourself in the shoes of the scholar you’re reading about. I don’t think people want to listen to a collection of Whitney Houston, “The Planets,” 80s pop rock, the occasional country song, and Big Ten fight songs (shut up), though.
Since this page is a reflection of me both as a scholar and a person, I try to care about what I put on it. Thinking about the “About” section I currently have makes me wonder how well I’m doing that.
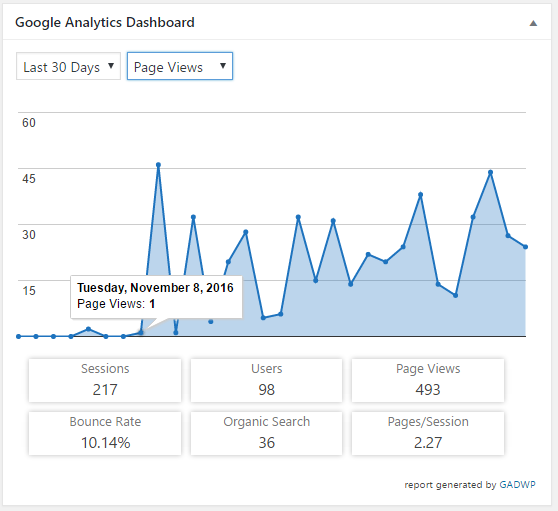
In particular, though, the vain, egotistical man that I am is curious as to whether anyone actually uses my site other than me, Dr. Leon, and my mother (hi, Mom! Sorry you just got my Christmas list). To that end I installed Google Analytics the day after I created my site. It was all pretty innocuous, the occasional spike when I’d do my blog post (up to 3 or 4 if I was lucky!), but nothing exciting. Then the election happened.
The day it all changed.
I saw that and thought, “Wow! People loved my thoughts on the election and what it means for how we study Midwestern politics going forward!” (And some of us do! Stay tuned for a collection of essays Jon Lauck is soliciting on Midwestern politics that’ll be done sometime before the 2020 election!)
Those spikes since, I told myself, were no doubt because I’d done a great job with SEO on my blog posts and really made things interesting for people looking for reviews of Visualizing Emancipation or the role of Digital Humanities in graduate school training.
Nope.
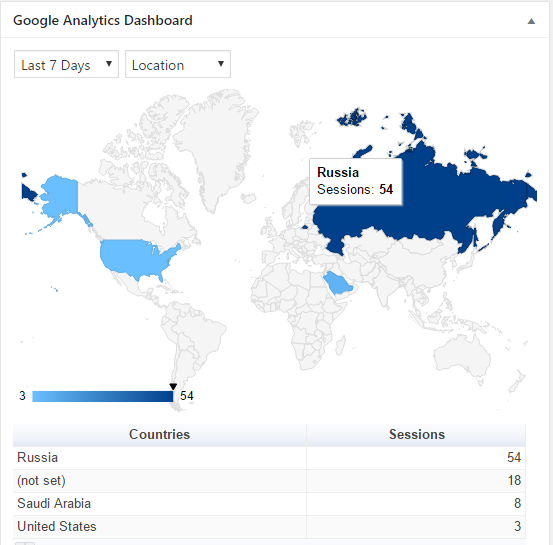
Once I realized I could filter by location, I learned something very, very different: Something or someone based in Russia is hitting my page at very high rates.
Even Saudi Arabia is outdoing my American audience. So Dr. Leon, if suddenly my project goes from African Americans in the election of 1896 to the Great Game or discussions of migration across the Rub’ al Khali, you’ll know why.
Russian and Saudi friends, hi! If you’re hiring a scholar to teach Midwestern political history, I’m your guy. (Yes, I know it’s spam.)
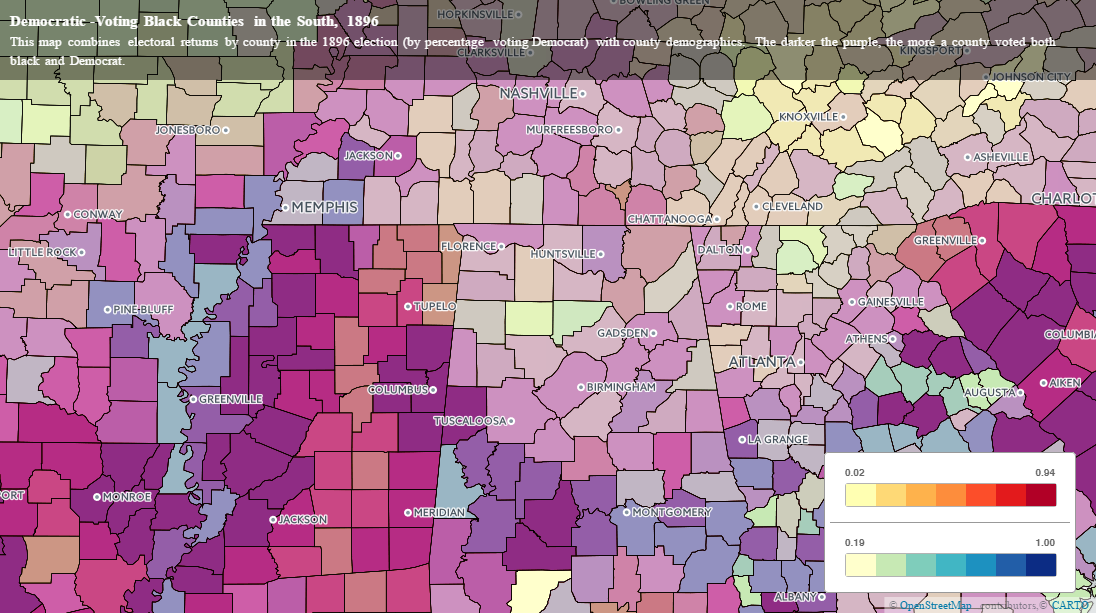
The map I’ve embedded below displays a combination of the 1890 census data by percentage African American with the percentage of each county voting Democratic in the election of 1896. The darker purple a county is, the more African American and Democrat-voting it was.
The map is enabled to toggle between four different layers, which I’ll briefly describe:
county_plus_vote is the layer which forms the blue chloropleth gradient in the legend. The darker blue a county, the higher percentage Democrat it voted. Turning all the other layers off would mean only this layer is displayed.
table_1890_black is the layer which forms the red (Emily says “warm colors” because I’m color-blind and need to ask for help) gradient in the legend. The darker red a county, the higher percentage of African Americans making up its population. Turning all the other layers off would mean only this layer is displayed.
table_1896_results is the layer which produces the information boxes when you scroll over a county. It doesn’t color the map at all (or at least it shouldn’t), so you’re not in for a very exciting map if this is the only one you turn on.
events_of_note is the on-going part of this map. Using the resources of Chronicling America through the Library of Congress, I am finding regions where there is a noticeable differentiation in color, then searching those cities’ newspapers with terms like “Negro [and] Bryan” in a 10-word proximity to see what political reports had to say about blacks’ participation in the election. Clicking on these points reveals a pop-out box with (1) the name of the article/editorial/news clipping, (2) where that clipping is from, and (3) a link to the primary source’s item page in Omeka.
There won’t be many events of note just quite yet, but we’re working on cataloging those in Omeka and adding them as points to the map. Feel free to play around with the map and zoom in on various counties! If there are issues with the functionality, please let me know in the comments.
The South Carolina Example:
You can see that the map is currently zoomed in on South Carolina as the default. Here’s why: I’m really curious about the divide between Richland County (home to Columbia, the state capital) and its surrounding counties. You’ll note that neighboring Sumter County (to the immediate east), with a higher percentage of African American voters than Columbia, voted even more overwhelmingly Democrat.
That led me to ask–why? Blacks are commonly associated with the Party of Lincoln, even in the South, and unless voter suppression had already taken place wholesale in Sumter County, it interests me to ask why voters might have gone Democrat.
Lo and behold, my Chronicling America search turned up the endorsement of Bryan and free silver by the Sumter Watchman and Southron, which reprinted an editorial from the Atlanta Daily Opinion. If you zoom in and click on the pin I’ve dropped, it leads to to the article’s Omeka page, where you can find a PDF.
More of these, along with bibliographic citations (particularly from Omar Ali’s In the Lion’s Mouth, will be forthcoming. The map, however, was the biggest technological hurdle to clear in this project, and I think we’ve really done something here which can open the door to questions about voter turnout (and suppression), rural-urban divides in Southern voting patterns, and regional distributions of Democratic votes and how those may overlap with distributions of African American voters–the Missouri River Valley in Missouri is particularly intriguing.
Over three decades removed from emancipation, in 1896 African-Americans began to move out of virtually one-party allegiance toward the Republican Party and consider allying themselves with the Democratic Party. Why?
I am studying African-Americans’ role in the election of 1896, because I want to find out who supported William Jennings Bryan and why, in order to understand African-Americans’ relationship to populism and the Democratic Party of the 19th century.
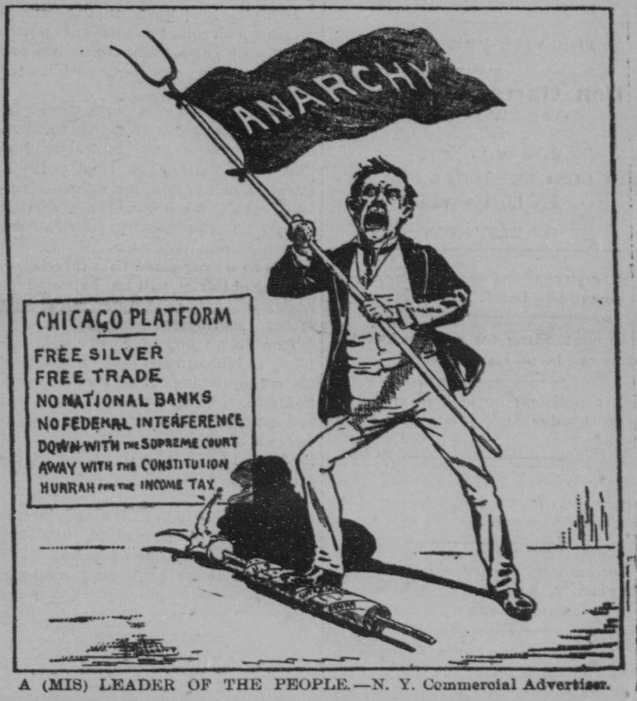
This cartoon originated in the New York Commerical Advertiser and was run in the October 10, 1896, issue of The Richmond Planet.
That cartoon, on the whole, makes a lot of sense, right? African-Americans voted for Republicans in overwhelming majorities after Reconstruction, as Abraham Lincoln’s party was the one which emancipated so many of them. Pretty standard, textbook stuff.
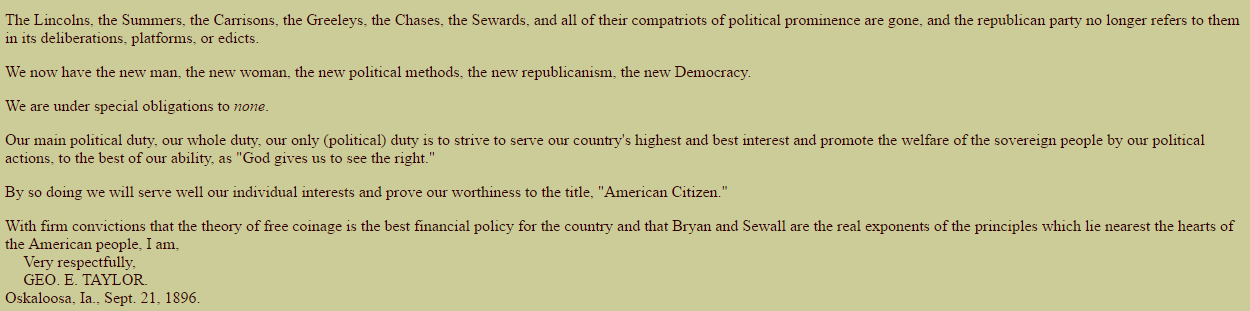
But then we take a look at this:
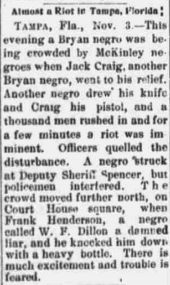
An Oskaloosa, Iowa, African-American indicts the Republican Party of 1896 for failing to protect African-Americans’ economic well-being.
That’s…different. In particular, that man, George Taylor, argues that while only 15% of African-Americans lived (in 1896) in what he called the “Mississippi Valley,” they represented a substantial voting bloc which was fed up with policies like the gold standard and tariffs supporting the moneyed interests of the East.
So we’ve got two opposite political planks, being articulated by African-Americans, on the same subject. Why?
Well, so far I don’t know. But I’m thinking Taylor might’ve been onto something–region and occupation may well have something to do with blacks’ political preferences in the election of 1896.
The sources I’ve loaded into my Omeka page reflect those disparities and, in the coming weeks, will hopefully expand to provide a wider picture of the 1896 election. Using the Daniel Murray collection of African-American pamphlets, the Library of Congress Chronicling America project, Slave Narratives from the Federal Writers’ Project, and perhaps electoral data if I can get my hands on it, I want to chart the 1896 election to show (1) where African-Americans were articulating political thoughts, (2) what those thoughts were, and (3) if there are any regional or socioeconomic factors which contributed to those thoughts.
A Brief Bibliography:
Adam, Anthony J. Black Populism in the United States: An Annotated Bibliography, Westport, CT: Praeger, 2004.
Ali, Omar H. In the Balance of Power: Independent Black Politics and Third Party Movements in the United States, Athens: Ohio University Press, 2008.
Ali, Omar H. In the Lion’s Mouth: Black Populism in the New South, 1886-1900. Jackson: University Press of Mississippi, 2010.
Gaither, Gerald H. Blacks and the Populist Movement: Ballots and Bigotry in the New South. Tuscaloosa, Ala: University of Alabama Press, 2005. Second edition.
Goodwyn, Lawrence. The Populist Moment: A Short History of the Agrarian Revolt in America. New York: Oxford University Press, 1978.
Hahn, Steven. A Nation Under Our Feet: Black Political Struggles in the Rural South from Slavery to the Great Migration. Cambridge: Harvard University Press, 2003.
Harpine, William D. “Playing to the Press in McKinley’s Front Porch Campaign: The Early Weeks of a Nineteenth-Century Pseudo-Event.” Rhetoric Society Quarterly 30, no. 3 (2000): 73-90. http://www.jstor.org/stable/3886055.
Ostler, Jeffrey. Prairie Populism: the Fate of Agrarian Radicalism in Kansas, Nebraska, and Iowa, 1880-1892. Lawrence, Kan: University Press of Kansas, 1993.
Postel, Charles. The Populist Vision. New York: Oxford University Press, 2007.
Sipress, Joel. “A Narrowing of Vision: Hardy L. Brian and the Fate of Louisiana Populism.” The Journal of the Gilded Age and Progressive Era 7, no. 1 (2008): 43-67. http://www.jstor.org/stable/25144508.
Wang, Xi. The Trial of Democracy: Black Suffrage and Northern Republicans, 1860-1910. Athens: University of Georgia Press, 1997.
So far I’m not quite sure what I’m going to do with Omeka. It provides a place to catalog a bunch of sources, but as an item-based content management system, I don’t think I’d be posting any of my items in my actual dissertation research to it.
Perhaps this is the tribalism I’ve felt in the world of research and academic publishing. The moment I put something out there that’s a source, someone can grab it and do their own work with it, possibly scooping me in the process. Grad school has been really good at putting “The Fear” in me that someone else will publish my research first, and because I know I’m using sources and materials that no academic has seen, touched, or possibly even known existed, I don’t want those things getting out there. Maybe the Public/Private function is reason enough to do that. I don’t know (right now in my studies) that the amount of time spent justifies the work.
The Klement Lecture
Last week at our Klement Lecture, Dr. Stephen Berry of the University of Georgia gave a talk entitled “Drinking Yourself to Death in the Grand Age of Temperance: Edgar Allan Poe and the Art of Self-Destruction.” The talk aside (which was extremely interesting), my favorite parts of visiting scholars are the opportunities the department gives graduate students for a “meet and greet.” Since Dr. Berry has done work on CSI: Dixie and Marquette is in the midst of a yearlong “Digital Humanities for evvvveryone!” kick, many of us had questions about that project and the field of Digital Humanities as a whole.
Along with his emphasis on “Form follows function” (let your research determine your need for certain aspects of DH), Dr. Berry also gave a very illuminating answer to a question about why most DH projects are a scholar’s second or–more often–third project (usually after they’ve received tenure). He noted not only a lack of literacy on the part of departments to learn what the value of a digital project is, but an academic system of publishing and producing research which often made it impractical for graduate students to actually commit to DH. While he argued that he was obviously in favor of increasing digital scholarship among graduate students, he sympathized with the difficulty faced by graduate students and junior faculty in doing DH work if it was not properly rewarded.
Of course that’s not to say any one person has the answer or that there aren’t programs which actively reward DH; more programs figuring it out and pushing it appropriately would certainly sweeten the pot for the rest of us, though.
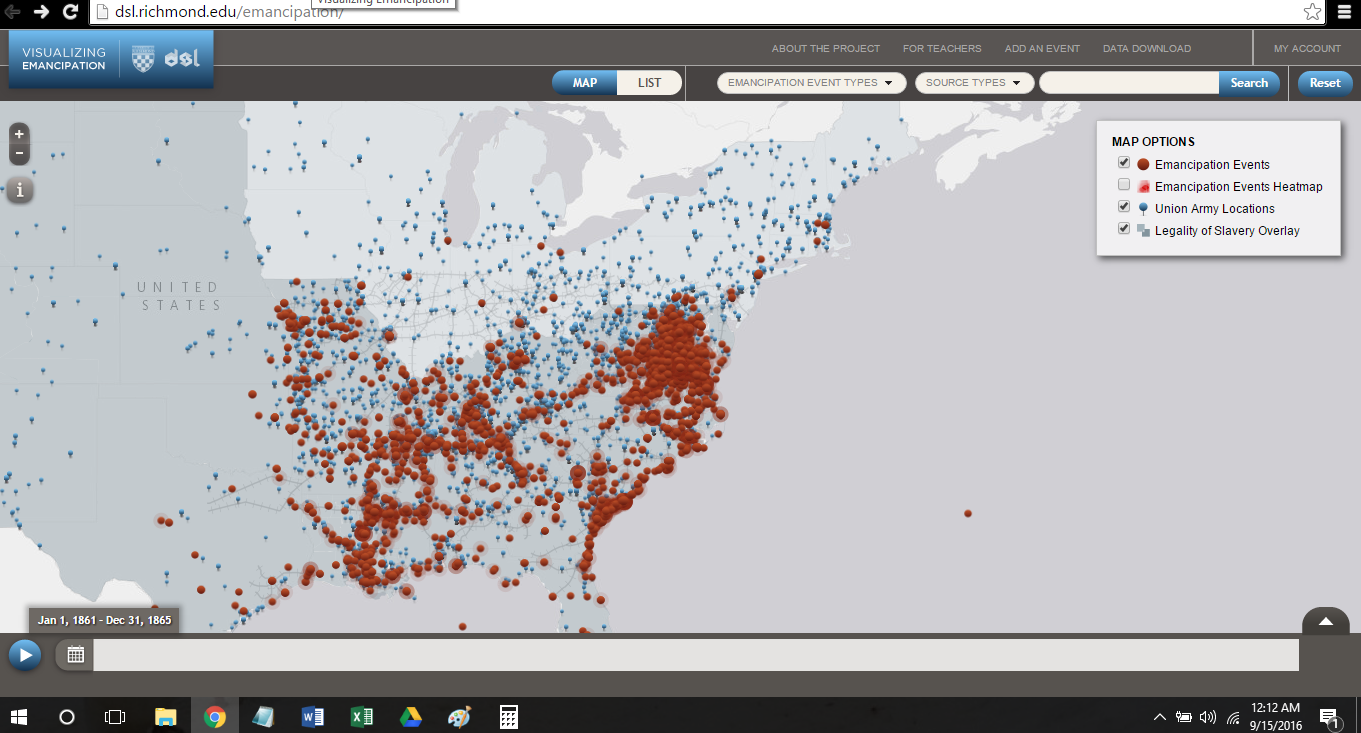
Published in 2012 by the Digital Scholarship Lab at the University of Richmond, Visualizing Emancipation is a interactive digital project “mapping the interactions between federal policies, armies in the field, and the actions of enslaved men and women on countless farms and city blocks.” Geared toward scholars, students, and teachers alike, Visualizing Emancipation provides a geographic examination of emancipation during and after the Civil War,
Various sections of the website serve as a digital narrative, teaching resource, and data set. First and foremost, visitors to the site will land on the map page, though an instructional introduction lays out the website’s purpose (quoted above) and its intended audience,then provides links to three different pages: “For Teachers,” “Get Started,” and “Learn More.” We shall return to the latter two, because while “Get Started” brings visitors right to the map, “Learn More” sends visitors to the “About” page, which is useful context for exploring the website.
(It is worth noting, additionally, that “Learn More” should really read as something which more definitively points to an “About” page. Those pages are additionally accessible by the “About the Project” link at the top of the map page.)
The “About the Project” section notes the basics of the project, a discussion of methods, an explanation of the types of events, and a rundown of the contributors to the project. The data for the project comes primarily from the Official Records of the War of the Rebellion (Washington, DC: Government Printing Office, 1880-1901), and the authors are careful to note the distinctions in various sections of the army, territorial legalities of slavery, and differences in emancipation events. The latter, in particular, helps explain why some of the red-dot emancipation events have particularly large halos around them–many events, especially those of sexual violence, could not be pinpointed with particular accuracy. In total, the undergraduate students scouring a number of contemporary sources, especially the University of Virginia Valley of the Shadow project, compiled over 3400 events.
Moving to the map, users are initially met with a screen zoomed out to encompass the entire South and most of the theater of the Civil War:
Pressing the play button in the bottom left-hand corner begins a timeline scrolling on the bottom of the screen corresponding to month-long segments of the Civil War. Given records available, pins appear on the map detailing the position of Union troops, while emancipations appear as they occurred, then disappear. Filters are available in the top right-hand corner of the screen. The “heatmap” option is not selected by default, though it is useful for providing a more general overlay.
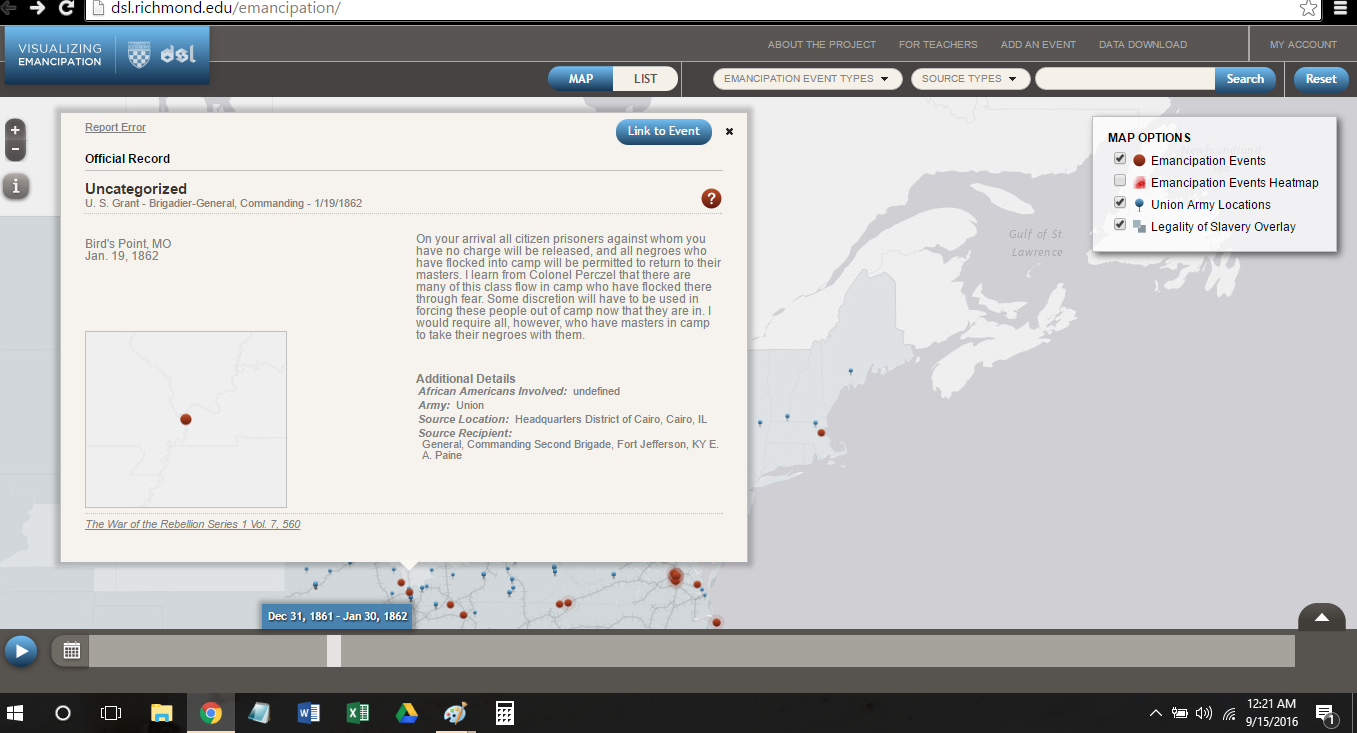
Clicking the events opens a popout screen within the map:
The popout box, while a bit cumbersome, contains a lot of detail. A newspaper description of the event, along with details as available, a date, and a citation provide context for the emancipation. Moreover, the dropdown menus immediately above the map allow the user to sort events (the above example is “Uncategorized”) like “Fugitive Slaves/Runaways” or “Irregular Fighting (insurrection, raid),” among others, and source types.
Ultimately, the mapping timeline demonstrates a number of facets to emancipation. To be sure, older historians of Civil War era emancipation are vindicated–slave emancipations, especially self-emancipations, would occur in locations with little-to-no army presence. But it is clearer that as the Union army advanced, emancipations increased.
The For Teachers section provides a number of links and lesson plans for teachers, particular upper-level high school and college. While the details are sparse and some pages beyond the landing page are under construction (have they ever not been?), Featured Events provides educators a useful jumping-off point for incorporating Visualizing Emancipation into the classroom through following individual emancipation to points on the map.
The project is ongoing, however. Links for scholars to submit events of emancipation and download the data as a KML file allows Visualizing Emancipation to be relevant to higher-level research and, much like other projects like the Living New Deal (which I use in the classroom through an interactive Google Docs project), continue to evolve.
Some confusing word choices (the landing page could do with a little more clarity of direction) and clunky layout in the “About” section (so much gray space in the margins) do create a nuisance but fail to distract from the overall impressive scope of the project. On a more scholarly level, adding the experiences of western slaves, particularly in Confederate Arizona and New Mexico, along with continuing to mine Northern cities for accounts of arriving emancipated slaves, would help to broaden the geographic focus. Emanicpation was a national experience, even if the political events of the time (like the Proclamation) did not, as the map nicely delineates, actually ban slavery in border states.
Also impressive is that Visualizing Emancipation works nicely on mobile devices and could be a boon to both interactive high school classrooms with iPad carts or college discussions where students may only have mobile devices. It is a solid and illuminating work of scholarship which continues an ongoing trend in historical scholarship to join space and experience together to expand the sociocultural history of slavery and emancipation.
We have a visiting professor from George Mason, Dr. Sharon Leon, at Marquette. She’s teaching HIST 5953, The Digital Past, in which we learn how to research, navigate, and create history online.
This class involves absolutely no textbooks; instead, Dr. Leon required us to purchase a one-year domain name. As part of both this class and my “professional internship” with the Marquette Digital Scholarship Lab, I am apparently now an historian-in-training online. So for at least this semester and probably the next year of my life, I’ll be online!
Going forward I’ll be adding tidbits from my professional life here, my CV, and assignments from class. As I type this, we’re also learning how to create different categories and publish posts. Good student that I am, I’m sure I missed at least two or three salient details to publishing and categorizing our blog posts online.