The assignment:
At the completion of the semester, you will write a reflective essay that summarizes your learning and growth during the class. These essays should be no more than 2,000 words. This is a chance for you to process your work and to consider the ways that it will contribute to your future ventures.
This is my last assignment of 2016. We finally made it.
Reflecting on a semester of learning a methodology I was not particularly thrilled to take up provides an opportunity for some much-needed introspection. “The Digital Past” has taught me not only a great deal about the theory and practice of disseminating historical scholarship online, but also technologies I plan to put to good use as a scholar and methods I hope to employ in the classroom.
Merely creating my own page on Reclaim and embracing the idea of having a blog was a substantial step forward in understanding digital history. While I had generally known how “the Internet works,” which we explored with the help of a 5-minute video during the first class, getting signed up for Zotero (which, yes, I have used on every major paper since) and learning the ins and out of some of the various styles of website (according to Cohen and Rosenzweig: Archival, Teaching/Learning, Exhibits, Organizational) really helped better understand that I have interacted with Digital Humanities (or History or Scholarship or whatever today’s in-vogue term is) a lot in the past. Having used exhibits like the Living New Deal project, it’s nice to know that there are even primary-based websites like the September 11 Digital Archive where I can incorporate sources from participants to challenge students to be historians in their own limited ways.
While it stood to reason that websites and the ways in which they were curated or designed could “make an argument,” most of my historical training to date dealt with how to do that through text, not imagery. That’s why The Real Face of White Australia made such a powerful impact on me regarding how my preferred stomping ground (political history) has such profoundly social and cultural implications. Without one word. That’s cool, and a methodology which could just as easily be applied to American immigration policy, settlers of the Midwestern frontier, mining companies in the West, and countless other places I’ve had my research take me.
The use of particular digital methods like text mining and structuring/tidying data particularly informed my brief foray into the role African Americans played in the election of 1896 across the South. More generally, I wanted to learn how to use mapping softwares like Carto or Tableau but needed a good excuse to use my past work with electoral results [thanks, Dr. Leon, for humoring me] to learn how to produce tidy spreadsheets, deploy shape files, and combine datasets in ways which would allow me to produce good digital content of any kind for my dissertation (more on that later).
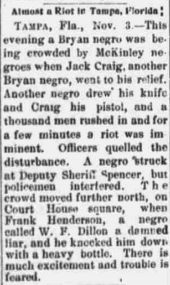
Regarding the actual project, there’s a lot more I wish I would have done, because it seems like a fun project, at the very least. In the historiography of black populism, I think there is still room to answer questions of how intra-African American violence like the brawl in Tampa were perceived both within and outside the African American community. There were real debates, fights, education projects, and rallies within the African American community for and against the causes of populism, and the social history and its political outgrowths would make for excellent further study. While my work notes some rural-urban and South-North tensions (the latter usually depicted as “educating” the excitable and undereducated former), it’s obviously not encompassing enough to produce anything too exciting.
The real strength, in my mind, is the mapping technique I employed, which overlaid percentages African American from the census with percentage of Democratic vote in 1896. That allowed me to search by newspapers for instances of “Negroes” being excited by things like “Bryan” or “Populists” and even “free silver” based on counties being particularly purple (black and heavily-Democrat).
Moving Forward
Most importantly, I’m excited to take the lessons and skills learned in this class and apply them to my own scholarship. I want to chart the rebuilding of the Democratic Party in the Upper Midwest from the 1978-80 defeats (and death, for Hubert H. Humphrey) of men like George McGovern (SD), Wendell Anderson (MN), John Culver and Dick Clark (IA), Gaylord Nelson (WI), and others, to the rise of a new brand of Democratic Party merging agrarian and urban interests behind politicians like Paul Wellstone (MN), Russ Feingold (WI), Tom Harkin (IA), Tom Daschle and Tim Johnson (SD), and Kent Conrad and Byron Dorgan (ND). More importantly, these men (and other women as well!) were supported by a rebuilt grassroots network of activists committed to progressive economic positions and a message of revitalizing the depressed Midwest.
But finding grassroots activists is easier said than done–that’s where my mapping project and the associated skills come in. I plan to tidy up my existing electoral data on Midwestern elections (statewide to start, bringing in Congressional districts eventually) and map out the shares won by Democrats in every major election from 1978 to 1992. As I’ve charted elsewhere, at least in the presidential election of 1992 the electoral geography of the Midwest looked markedly different that it does today. More importantly, perhaps, the rural Midwest looked very different in 1992 than it did in 1984. Midwestern Democrats clawed their way back to relevance in the subsequent eight years, but using mapping like I did in this project to shade counties which made greatest gains in Democratic turnout would allow me to start there and look for local Democratic committees, caucuses, or networks which contributed to the party’s rebuild.
On the Omeka side of things…I’m less confident how I’ll be using it going forward. It will perhaps be of more value to me someday than now. The sources (PDFs and otherwise) that I obtain during my dissertation research are mine and hopefully mine alone, because there’s more value in my dissertation the more new information I am able to use to challenge existing narratives of conservative politics in the 80s. Instead, if someday I do wind up working on a collaborative project through [God willing] a university or other group, it will be nice to know the value of structured metadata and digital cataloging.
Teaching, Too
As I mentioned, I already use digital projects like the Living New Deal to find new and more creative ways to interact with students and demonstrate the importance and relevance of American history to their daily lives. Here is where I think Omeka offers the most opportunity for collaborative and innovative classroom work to help students take on the role of historians. My ability to upload and catalog documents (and sort them by “Exhibit” or “Collection”) would allow, in more focused classes like one on urban history or the Midwest, me to create a collection of primary sources for the students to read, use, cite, and even potentially add to in the case of more advanced undergraduates.
If, over the course of my studies, I do a more locally-focused project (say, following the model of the excellent Minneapolis project Mapping Prejudice, built out of the model of Mapping Inequality), then I would really enjoy using something like Omeka (perhaps with the Neatline plug-in as well) to use local documents (like the covenants, in the case of Mapping Prejudice) to provide the primary sources to go with the digital work.
In All
Digital humanities continues its march forward in scholarly conversations in the 21st century. I had the opportunity to attend panels related to public and digital history during conferences in both St. Cloud (the Northern Great Plains History Conference) and St. Paul (the Western History Association) in the fall of 2016, and in my own field of Midwestern history there are great things being done using digital methods–look no further than Historyapolis and Mapping Prejudice, which have pushed some excellent young scholars to the forefront.
Moving forward, I’m excited to see what projects like Historyapolis, #Heartlandia (led by Chris Cantwell at UMKC), and others highlight as part of the essential character of the Midwest. I hope my research can play some role in that, and digital methods I have learned in HIST 5953 will no doubt be of service in that endeavor. I entered the class preferring the written word to the digitally-displayed one, and I still prefer the monograph or article to the exhibit or archive, but the lessons and methods of The Digital Past will no doubt be of service.
Things like tidy data, structured metadata, text mining, data visualization, and mapping will inform various aspects of my research, teaching, and scholarly engagement going forward, for better (I hope) or worse, and knowing there is a vibrant digital community in the Midwest means these methods become even more relevant to my everyday work in history. A special thank-you to Dr. Leon, the Marquette Digital Scholarship Lab, and my colleagues for their help, support, and feedback along the way. Hopefully you’ll be looking at some great maps and finding yourselves sucked into the gravitational pull of the Midwest sooner rather than later–we have more fun (and better beer!) than your average historical association!
It’s been a whirlwind semester, and as I now walk out a PhD candidate (having survived my doctoral exams) and the recipient of a generous summer research fellowship from the Wisconsin chapter of the National Society of the Colonial Dames of America–both of which I learned of on Monday afternoon, part of the culmination of a stressful and busy last month–I feel like a more complete historian-in-training. We’ll see where we go from here.