In preparation for a panel on the Midwest in the 2016 elections for the Midwestern History Association Conference in Grand Rapids this June, I’m working on my particular focus: down-ballot elections. My biggest problem was this–besides saying “things didn’t go well for Democrats,” I had little-to-no idea how to show that (Ted, if you read this, I swear things are going better now).
We talk a lot about the growing rural-urban divide between Republicans and Democrats, but elections within even my lifetime, like 1992 and 2008, demonstrate that a healthy amount of Democratic support came from rural and suburban areas. So where is it now? In order to fully come to terms with the landscape of the Democratic (the focus of my dissertation, thus its emphasis) and Republican parties in 2016, we need to find where they have support at the local levels.
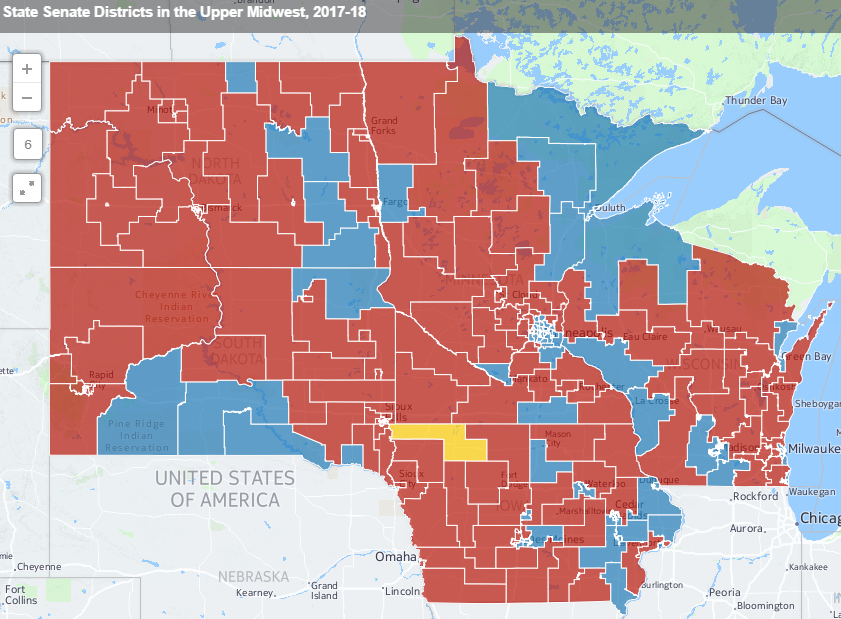
Mapping out districts seemed like a healthy way to start. There’s not much in this post besides basic maps of the State Senate and State House/Assembly districts for the Dakotas, Iowa, Minnesota, and Wisconsin, along with a similar text-box pop-up for each district with the district number, legislator name, party affiliation, and city. I followed the model I’m familiar reading in the papers, that of Rep. Joe Atkins (DFL-Inver Grove Heights).
There shouldn’t be much to navigating the maps right now, but do note the following:
Legend: Blue is Democratic-affiliated, red is Republican-affiliated, Yellow is non-affiliated (if that’s not yellow, remember I’m colorblind).
Party: Yes, I realize now I forgot to use North Dakota’s official designation, the Democratic/Non-Partisan League. Mea culpa. It’ll be changed for the next maps. Otherwise Minnesota’s Democratic-Farmer-Labor Party is denoted as “DFL”.
At-Large: No doubt in their efforts to kill me right as I was having a breakthrough, North Dakota and South Dakota both do not subdivide their Senate districts into House districts; rather, they elect two members at-large from each to fill House seats. (The only exceptions to this are the SD 26th and 28th, divided into A and B to ensure Native American representation.)
As such, two-Republican districts are shaded red, two-Democrat districts are shaded blue, and split districts are shaded purple. Thankfully, since both Dakotas are doing their best impressions of a one-party state, that is rarely relevant, unless there’s some research to be done into “Why Wahpeton, ND, is America’s Next Great Swing City.”
More info: Click the districts to see the legislators’ names.
(I’m having issues with the zoom default and Carto right now, so I’ll get that fixed as soon as possible.)
Senate Districts:
House Districts:
Obviously the rural-urban divides here are striking, and I’m surprised to see the Iron Range in particular staying DFL/Democrat in Minnesota and Wisconsin, given how they swung toward Trump in the 2016 presidential election. (But to discuss that now without my future mapping work would spoil the whole exercise in Grand Rapids!)
In the meantime, if there’s something you think should be added to this or that I should consider for analysis, let me know in the comments or by email.