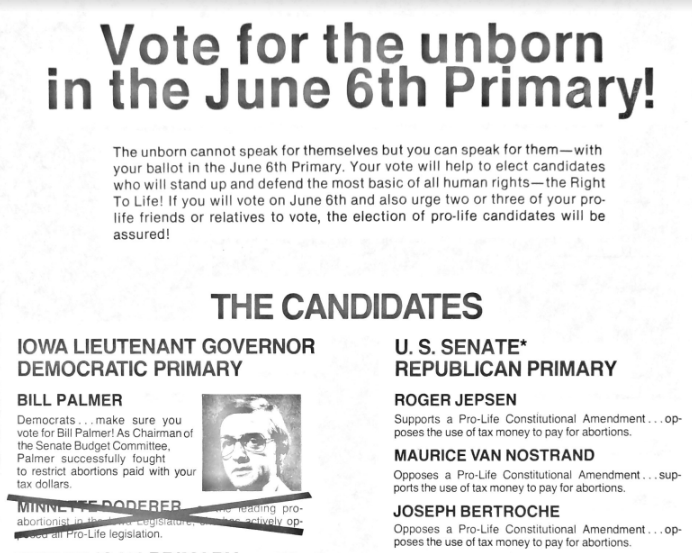
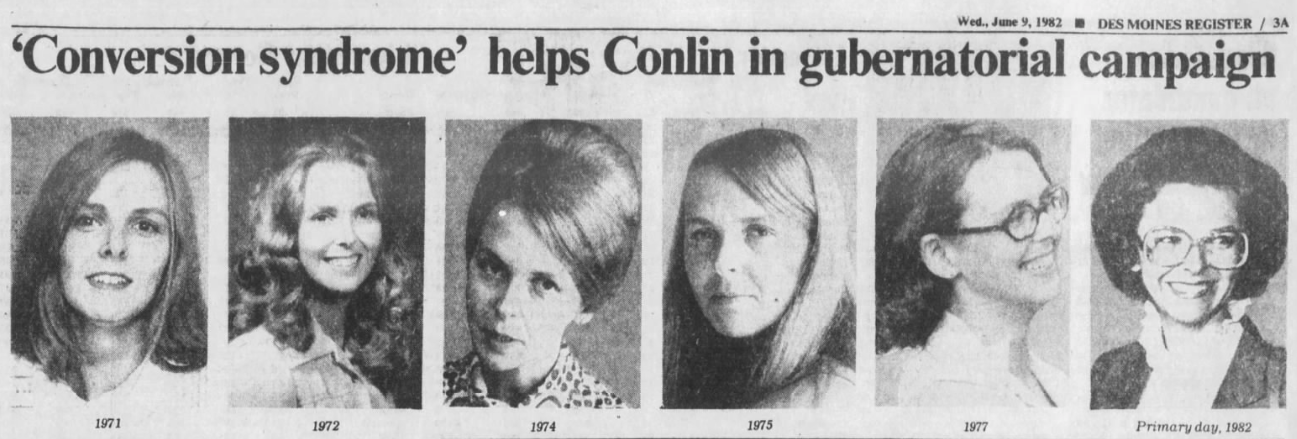
Whether a relic of a bygone era or totally applicable lesson in Democratic messaging, there’s a historical example for how Midwestern Democrats responded when confronted with anti-abortion rhetoric.
Dredging up offensive tweets from an Iowa State student whose sign went viral after College Gameday, spawning a grassroots philanthropic drive for a children’s hospital, the Des Moines Register once again reminds us of its past and present issues with sensational background details.
In preparation for a panel on the Midwest in the 2016 elections for the Midwestern History Association Conference in Grand Rapids this June, I’m working on my particular focus: down-ballot elections. My biggest problem was this–besides saying “things didn’t go well for Democrats,” I had little-to-no idea how to show that (Ted, if you read this, I swear things are going better now).
We talk a lot about the growing rural-urban divide between Republicans and Democrats, but elections within even my lifetime, like 1992 and 2008, demonstrate that a healthy amount of Democratic support came from rural and suburban areas. So where is it now? In order to fully come to terms with the landscape of the Democratic (the focus of my dissertation, thus its emphasis) and Republican parties in 2016, we need to find where they have support at the local levels.
Part of our assignment for this week–in addition to continuing to be the diligent and thoughtful students that we’re definitely, totally being on our projects–was to review another student’s website. Without posting the full review here, I was assigned Natalie Russell and Nick Ostermann’s site on the Gens de Couleur. They’re making an intriguing argument about the role free people of color (FPC) played in antebellum New Orleans and in turn demonstrating how they “whitened” themselves in official portraits and correspondence.
My greatest takeaway was the need for identifying and gearing presentation and media used to the audience you are trying to reach. Natalie and Nick had originally identified that they wanted to reach middle- and high-school students, and I think their biography style is a great way to give students something quick but still historically “deep” to read. I’d love to see them play up their primary sources, though, and play down their narrative. Maybe a catalog of the primary sources related to Julien Hudson at the top of the page, before the narrative, would help them do what I struggle with as an instructor–getting my students to actually engage with a primary document. A letter, rather than a portrait, would be even more ideal. While I love playing the “let’s analyze the coloration of American Progress” game as much as the next instructor, there’s something to be said for reading the handwriting and actual words of a wealthy New Orleans FPC.
She’s going from the light in the east to the darkness in the west! WHAT COULD IT MEAN?! Special shoutout to the one student of mine who complained about the two children riding in the covered wagon.
What this process has challenged me to do is better identify at whom I am targeting my map and the curated newspaper articles in my Omeka. The short answer I had at first was “I don’t know…grad students, probably.” On the whole I think that’s about where my thought process is at, because I don’t think historical electoral politics are getting a ton of people out of bed in the morning. I can better define that, though, and I will have to try and find a way to demonstrate that in my “About” section or my overall argument.
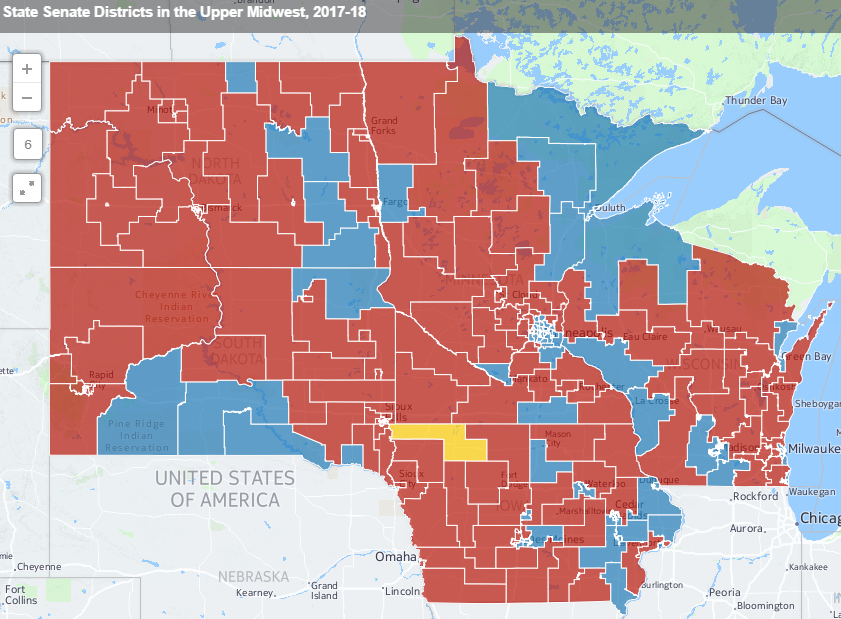
In “Cory doesn’t understand the Internet” news, I figured out Carto yesterday. Seriously, go look at my map. The findings could be wrong, insignificant, or just not that interesting, but I finally was able to make tidy data, upload shape files and datasets, merge them into a map, construct different layers, and display them in a manner approaching efficiency. It was the product of about two weeks of work and about 40 deleted maps and datasets (Carto kept uploading percentages as “strings,” not “numbers,” then deleting them when I’d try to convert them in the dataset), but it felt good to finally have that “Eureka!” moment yesterday.
But this is about what I don’t get about the Internet.
One thing I really enjoyed, going back to the review of Natalie and Nick’s project, was how Natalie embedded her Apple Music in her “About” page. That seems like a fun way to put yourself in the shoes of the scholar you’re reading about. I don’t think people want to listen to a collection of Whitney Houston, “The Planets,” 80s pop rock, the occasional country song, and Big Ten fight songs (shut up), though.
Since this page is a reflection of me both as a scholar and a person, I try to care about what I put on it. Thinking about the “About” section I currently have makes me wonder how well I’m doing that.
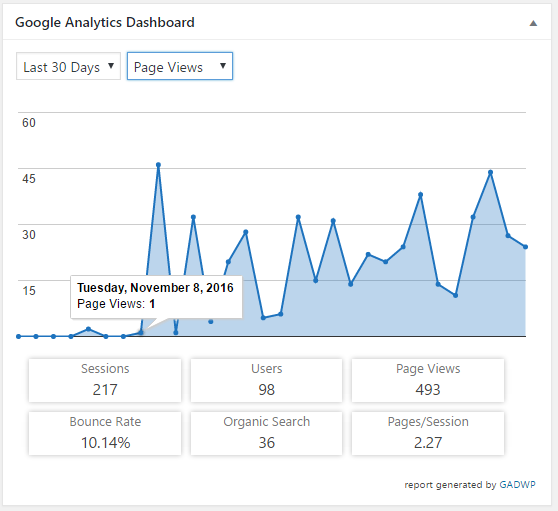
In particular, though, the vain, egotistical man that I am is curious as to whether anyone actually uses my site other than me, Dr. Leon, and my mother (hi, Mom! Sorry you just got my Christmas list). To that end I installed Google Analytics the day after I created my site. It was all pretty innocuous, the occasional spike when I’d do my blog post (up to 3 or 4 if I was lucky!), but nothing exciting. Then the election happened.
The day it all changed.
I saw that and thought, “Wow! People loved my thoughts on the election and what it means for how we study Midwestern politics going forward!” (And some of us do! Stay tuned for a collection of essays Jon Lauck is soliciting on Midwestern politics that’ll be done sometime before the 2020 election!)
Those spikes since, I told myself, were no doubt because I’d done a great job with SEO on my blog posts and really made things interesting for people looking for reviews of Visualizing Emancipation or the role of Digital Humanities in graduate school training.
Nope.
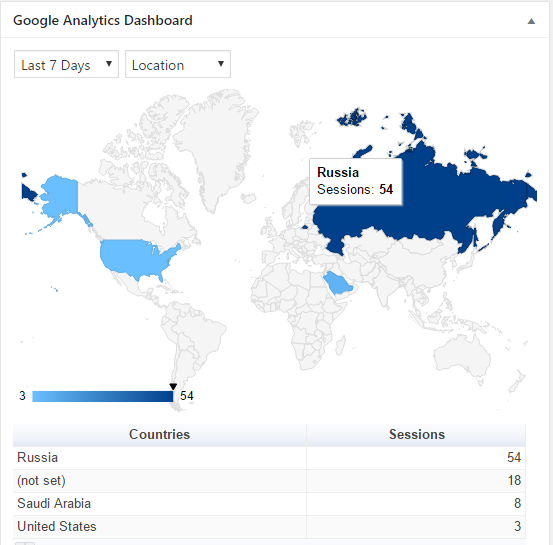
Once I realized I could filter by location, I learned something very, very different: Something or someone based in Russia is hitting my page at very high rates.
Even Saudi Arabia is outdoing my American audience. So Dr. Leon, if suddenly my project goes from African Americans in the election of 1896 to the Great Game or discussions of migration across the Rub’ al Khali, you’ll know why.
Russian and Saudi friends, hi! If you’re hiring a scholar to teach Midwestern political history, I’m your guy. (Yes, I know it’s spam.)
We have a visiting professor from George Mason, Dr. Sharon Leon, at Marquette. She’s teaching HIST 5953, The Digital Past, in which we learn how to research, navigate, and create history online.
This class involves absolutely no textbooks; instead, Dr. Leon required us to purchase a one-year domain name. As part of both this class and my “professional internship” with the Marquette Digital Scholarship Lab, I am apparently now an historian-in-training online. So for at least this semester and probably the next year of my life, I’ll be online!
Going forward I’ll be adding tidbits from my professional life here, my CV, and assignments from class. As I type this, we’re also learning how to create different categories and publish posts. Good student that I am, I’m sure I missed at least two or three salient details to publishing and categorizing our blog posts online.